Tracing & Audit
Every request a workspace makes — the agent's calls to LLM providers, package downloads, kubectl and aws traffic, ordinary web fetches — passes through Bromure Agentic Coding's host-side MITM proxy. Because the proxy already stands on that wire boundary, it can record what crossed it: which hosts the agent contacted, what it sent, what came back, whether any credential was swapped or leaked, and — for AI traffic — the full conversation, tool calls, and shell commands the model drove.
That record is the workspace's session trace. It exists for one reason: so you can answer, after the fact, "what did the agent actually do?" — down to the individual prompt, the individual rm -rf, the individual outbound request. Everything is recorded on your Mac, encrypted at rest, and (for individual users) never leaves it.
This chapter covers the whole system: what a trace captures, how it is stored and aged out, the Trace Inspector window, the bromure-cli trace command line, how to get data back out, and the privacy boundary between local audit and the telemetry that enrolled Macs stream to an organization. The field-by-field settings reference for the pane lives in Tracing settings.
What a trace records
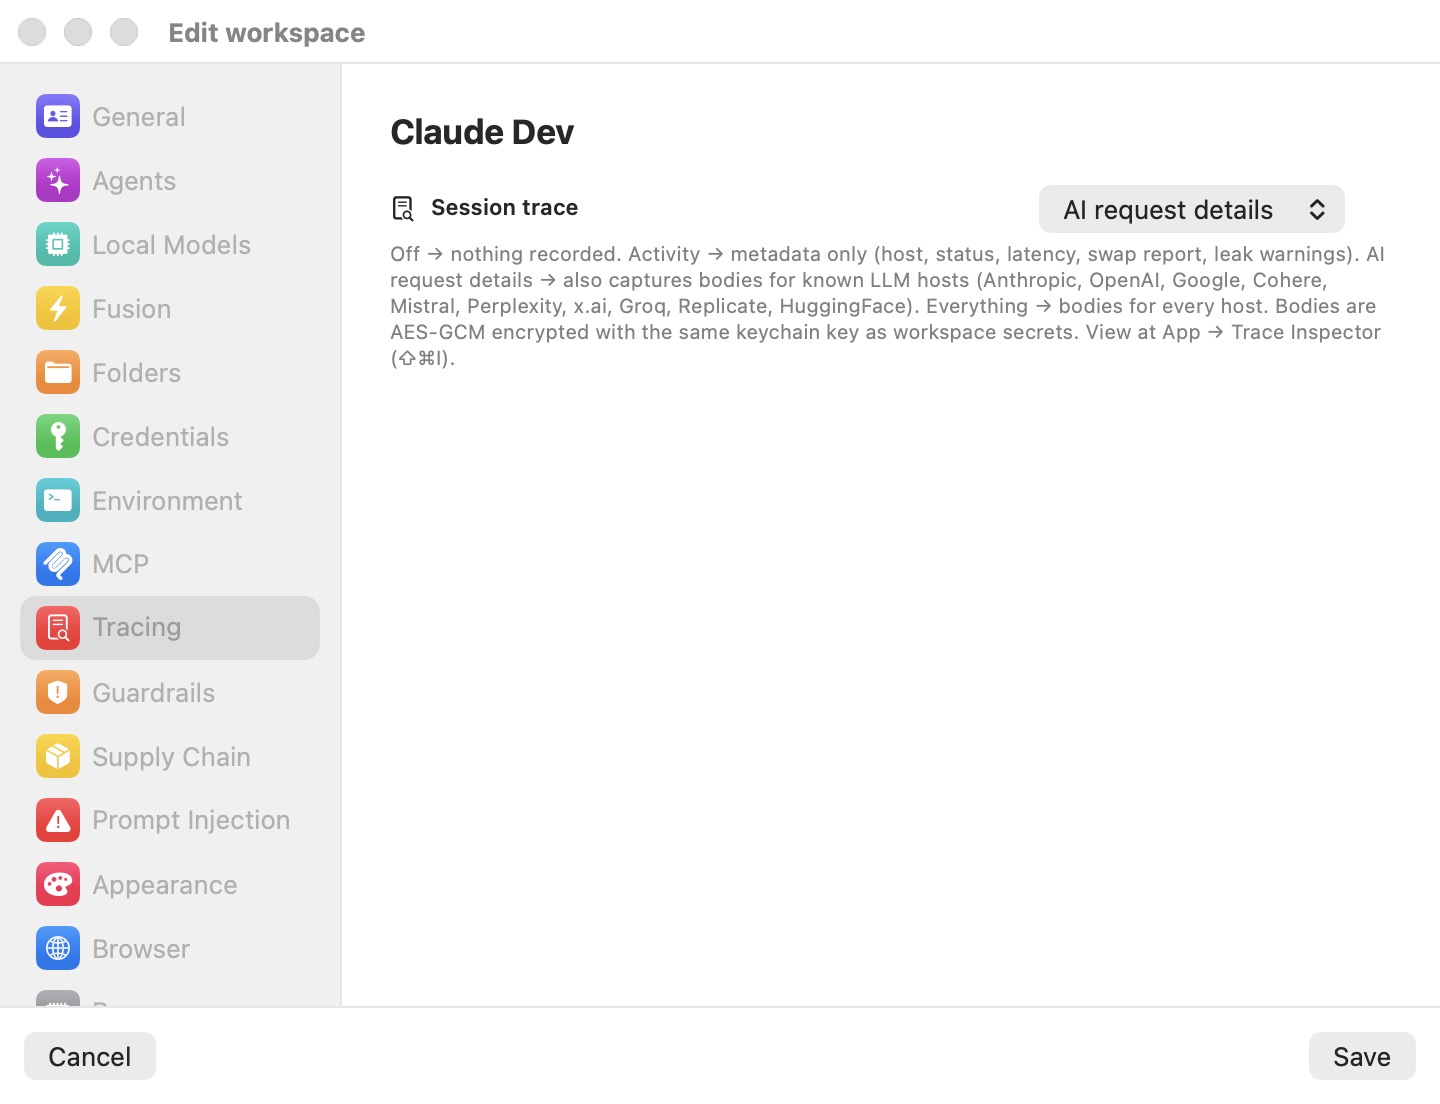
Tracing is per workspace, controlled by the Session trace picker in the Tracing pane of the Edit workspace window. It has four levels, each a superset of the one before it:
| Level | What is recorded |
|---|---|
| Off | Nothing. |
| Activity only | One metadata record per request — no bodies. |
| AI request details (default) | Metadata for every request, plus full request and response bodies for known LLM hosts. |
| Everything | Metadata for every request, plus bodies for every host. |
New workspaces default to AI request details, so agent conversations are auditable out of the box without storing the bodies of unrelated traffic (package downloads, telemetry pings) on disk.
Note: The trace level enum defaults to Off in the profile format, so a workspace whose stored JSON predates this setting decodes as Off. The AI request details default applies only to workspaces created from the current template. Choose the level deliberately when auditing matters.
The metadata record
At Activity only and above, the proxy writes one trace record per request. Every record — regardless of level — carries the metadata:
- Timestamp, host, port, HTTP method, and path.
- Status code and latency, measured from the
CONNECTthat opened the tunnel to the response. - Request bytes (measured before any credential swap) and response bytes.
- The token-swap report — which credentials the proxy substituted on the way out (see Credential swaps and leaks).
- Credential-leak warnings — bearer-style tokens in the outbound request that Bromure did not mint.
- Under local or hybrid model routing, which backend served the turn (see Local Models).
This is enough to reconstruct the full picture of who the agent talked to and when without keeping a byte of prompt or response text on disk. When you want the audit trail — contacted domains, credential handling, latency — but not the content, Activity only is the level to pick.
Captured bodies and parsed conversations
At AI request details, the proxy additionally stores the complete request and response bodies for the known LLM hosts: Anthropic, OpenAI / ChatGPT, Google, Cohere, Mistral, Perplexity, x.ai / Grok, Groq, Replicate, and HuggingFace, plus the local-inference host when a workspace routes to a local model. At Everything, bodies are kept for every host.
A captured AI body is not just stored — it is parsed. The Trace Inspector renders it as a Conversation view: the system prompt, each user turn, the assistant's replies, and the structured blocks the model emitted. Those blocks are exactly what makes a coding-agent trace useful:
- Tool calls — every
tool_useblock the model produced, with its input. - Shell commands — the
Bash/Shelltool calls, i.e. the commands the agent ran in the VM. - File reads and writes — the
Read/ViewandWrite/Edit/MultiEdittool calls, with the paths they touched.
So a single AI request record answers "what did the model decide to do this turn" — read this file, run that command, call this API — parsed out of the raw API body. The same structure is what the realtime event tap turns into audit events on enrolled Macs.
Credential swaps and leaks
Two credential-handling facts are recorded on every request, and surfaced prominently because they are the ones that matter for a security review:
- Token swaps. When the proxy replaces the decoy credential the VM holds with the real one on the wire, the record notes it — as first/last-character previews of the fake and real values (
sk-a…f9q3), never the secret bytes. This is the normal, healthy case: it confirms the swap system is doing its job. - Leaks. When an outbound request carries a bearer-style token that Bromure did not mint — a real secret pasted directly into the VM, bypassing the swap system — the record flags it as a potential leak, again as a preview only, tagged with a suspicion class:
knownPrefix(a recognized secret prefix Bromure didn't issue) oropaqueToken(a long opaque auth value). A leak flag is a prompt to investigate; the full mechanics of decoy credentials and compromise detection are in Credentials.
Encryption at rest and retention
Traces live under ~/Library/Application Support/BromureAC/traces/, organized by day:
- Metadata is appended as one JSON line per request to
traces/YYYY-MM-DD/<sessionID>.jsonl. - Captured bodies are stored next to it as
traces/YYYY-MM-DD/<sessionID>/<recordID>.req.encand.res.enc— AES-GCM-sealed with the SecretsVault master key, the same Keychain-held key that encrypts your workspace secrets. File permissions are0600.
Before anything is written, the record is sanitized:
- Sensitive headers are redacted.
Authorization,Proxy-Authorization,Cookie,Set-Cookie,x-amz-security-token,api-key, and any header ending in-api-keyare rewritten to<redacted>. - Secrets are stored as previews only. Token swaps and suspected leaks keep first/last-character previews — real secret bytes never enter a trace record, encrypted or not.
Retention is automatic and runs lazily (a cleanup pass every 200 appends):
| Cap | Behavior when exceeded |
|---|---|
| 100 MB of bodies per session | The oldest .enc body files for that session are evicted. The metadata lines stay — you keep the audit trail, you lose only the oldest captured text. |
5 GB across the whole traces/ directory | The oldest day-directories are deleted first. |
Separately, the app keeps the last 5,000 records in an in-memory ring for the live view; older records remain on disk within the caps above.
Warning: At AI request details and Everything, the full prompt and response text of AI exchanges is on disk — encrypted, but present. Because the bodies are sealed with the SecretsVault master key, rotating that key makes previously captured bodies undecryptable; the Trace Inspector then shows
(not captured / decryption failed)where the body would have been.
The Trace Inspector window
The Trace Inspector is the live, filterable viewer for every recorded exchange across all workspaces. It reads the same records the CLI does, and updates in real time as new requests flow.
Opening the window
Open it from Window → Trace Inspector… (⇧⌘I). It also opens pre-filtered to one workspace from a session window's toolbar, so you can jump straight from a running agent to its own traffic. On open, the in-memory ring is warmed from disk — reading today's and yesterday's day-directories only, so a cold launch is fast. Older records stay on disk and appear once you press the reload button while they are in range, or by reading them with the CLI.
The request list
The left pane is a newest-first list of records. Each row shows, left to right:
- A status dot color-coded by response class: green for 2xx, blue for 3xx, orange for 4xx, red for 5xx, gray otherwise.
- The method and host (the path is shown beneath, truncated in the middle).
- Badges, when they apply: an orange warning triangle for unswapped credentials (a potential leak), blue swap arrows for token swaps, and a document icon when a body was captured for this record.
- The status code and latency on the right.
The footer reads N records (last M in memory) and carries a Reload from disk button (the circular-arrow icon). The list has full keyboard navigation — ↑ / ↓ to step, PgUp / PgDn to jump ten, Home / End to reach the ends — with the newly selected row scrolled into view.
Filtering
A filter bar sits above the list:
| Control | Effect |
|---|---|
| Workspace picker | Narrow to one workspace, or All workspaces. |
| Leaks only | Show only records with an unswapped-credential warning. |
| Conversations only | Show only records the proxy parsed as an AI chat exchange. |
| Host filter | A substring match against the host. |
Note: Conversations only relies on a flag set when the record was written. Records captured before that flag existed count as non-conversations and are hidden by this filter until re-recorded.
The detail pane
Selecting a row fills the right pane. Its header shows the method, full URL, status, and a row of meta cells — Workspace, Latency, Request and Response sizes, and Time — plus a Conversation / Raw segmented toggle.
- Conversation renders the parsed AI chat: system prompt, turns, tool calls, and results, formatted for reading. It is available only when a body was captured and the exchange parsed as an AI conversation; otherwise the toggle falls back to Raw on its own.
- Raw shows the record's building blocks in sections: Unswapped credentials (potential leaks), Token swaps (each as
fake → realpreviews), Request body, and Response body. Bodies are decrypted on demand when you select the record.
Each body section has a copy button that puts the complete body on the clipboard — the full text even past the on-screen truncation, and a hex string for binary bodies. When no body was stored, or the master key can no longer decrypt it, the section reads (not captured / decryption failed).
With nothing selected, the pane shows a placeholder: Pick a request — Choose a row on the left to inspect headers, swaps, and (if captured) bodies.
WebSocket sessions
Long-lived WebSocket upgrades through the proxy — OpenAI Realtime, Codex's responses_websockets, and the like — are traced as a single record per WS session rather than lost as opaque binary. When the workspace's trace level captures bodies for that host, both directions are frame-parsed (RFC 6455): masking is stripped, continuation frames are defragmented, and permessage-deflate payloads (RFC 7692) are inflated, so text frames are readable instead of compressed garbage.
On close, the proxy appends a chronological transcript after the upstream handshake response and stores it as the record's response body, so the Trace Inspector renders it through the ordinary body path — Conversation view included when it parses as an AI exchange. A transcript entry looks like:
--- WebSocket session transcript ---
>>> [2026-07-13T15:30:05Z] TEXT 1234B
<<< [2026-07-13T15:30:06Z] TEXT 5678B (truncated, total 40000 bytes)
Limits keep a chatty session bounded: 1 MB kept per message, 4,096 messages per session, a 64 MB maximum frame, and a 32 MB maximum inflated message; anything past a cap is marked (truncated, total N bytes). Parse failures degrade only the transcript — the live tunnel pumps raw bytes and is never stalled or corrupted by tracing.
The Security Timeline window
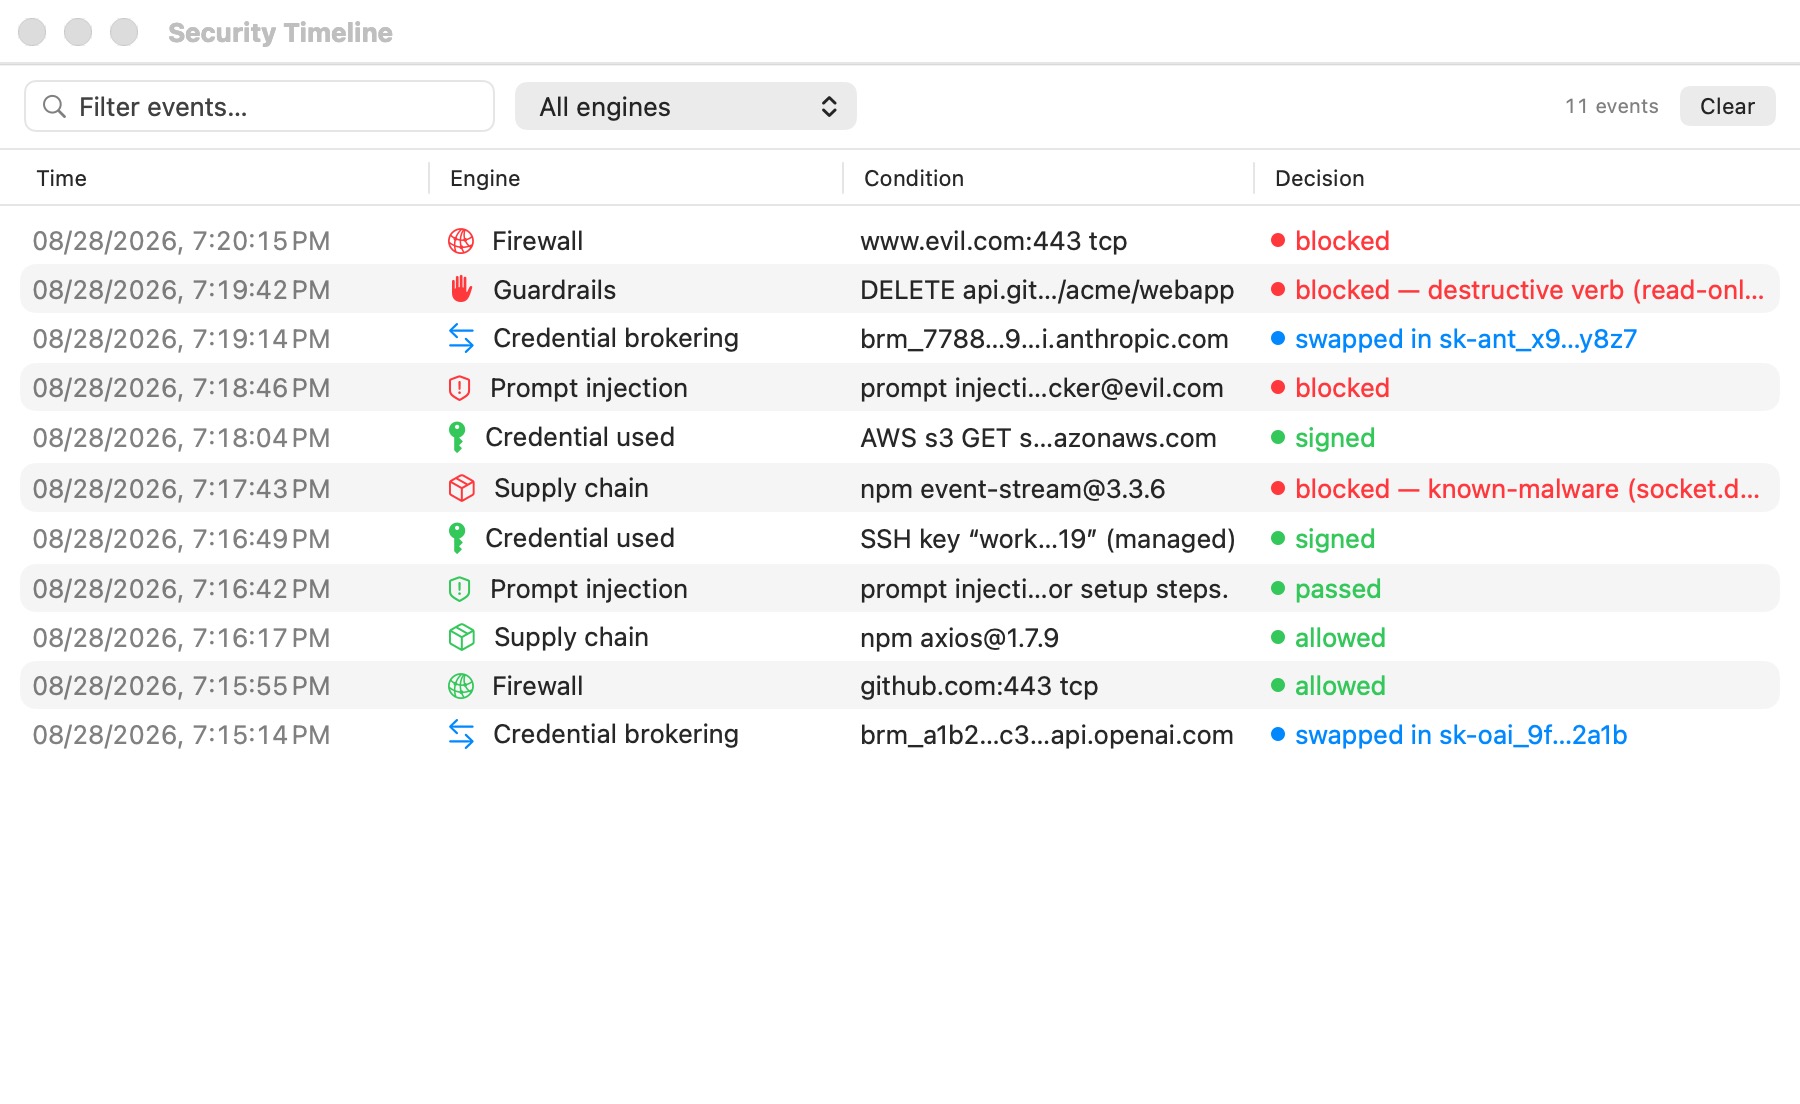
The Trace Inspector answers "what did the agent send?"; the Security Timeline (Window menu → Security Timeline…) answers "what did Bromure's security engines decide?". It is one chronological table — newest first — of every decision the engines made while your workspaces ran:
| Engine | Example rows |
|---|---|
| Credential brokering | brm_a1b2… → api.openai.com — swapped in sk-oai_… (blue); blocked — exfiltration attempt, VM paused (red) when a fake credential was caught leaving for a host it was never minted for. |
| Firewall | evil.example:443 tcp — blocked — every egress-firewall verdict. |
| Supply chain | npm [email protected] — blocked — version is 2 days old and allowed installs alike. |
| Guardrails | DELETE api.github.com/repos/… — blocked write-policy enforcements. |
| Prompt injection | Detector hits with the flagged snippet's preview and the action taken. |
| Credential used | SSH signatures and AWS SigV4 signings performed by the host on the agent's behalf. |
| Upstream TLS | Upstream certificates the host refused to trust. |
Rows are colour-coded by outcome — green for allowed, red for blocked, blue for informational transformations — and the toolbar filters by engine or free text. The timeline is an in-memory "what just happened" view (capped at 5,000 rows), not an audit store: for durable evidence use the session traces, which outlive the app run and are encrypted at rest.
The engines all run on the host, so when a remote client mirrors this Mac the timeline mirrors too: the host ships its recent decisions inside the state stream and the client's Security Timeline window shows the same rows.
The trace CLI
The bromure-cli trace command group gives you the same trace data in the terminal. It is a thin client: it talks to the running app over the local control socket, so the GUI app must be running (the rich client tunnels the identical protocol over SSH to reach a remote instance).
| Command | What it does |
|---|---|
bromure-cli trace ls [workspace] [--limit N] | List recent requests, newest first (default 50 rows). Columns: TIME, HOST, METHOD, STATUS, REQ, RESP, LAT, and FLAGS (swap×N, LEAK×N, conv). |
bromure-cli trace summary [workspace] | Aggregate view: request and host counts, bytes up/down, a status-class histogram, swap/leak/conversation counts, and the top 10 hosts. |
bromure-cli trace hostnames [workspace] | Every distinct host contacted, with request counts. |
bromure-cli trace leaks [workspace] | Only requests with a potential credential leak — header, value preview, and suspicion class. Prints No leaks detected. ✓ when clean. |
bromure-cli trace clear [-f] | Wipe all trace history — the in-memory ring and the on-disk files — after a y/N confirmation (skip it with -f). Reports how many records were cleared. |
The optional workspace argument filters by id or name. If tracing is off for the workspace (or nothing has been recorded yet), trace ls prints No trace records. (Tracing is per-workspace — enable it in the workspace's settings.); if the app is not running, every subcommand prints No bromure-cli agent running. The full CLI is documented in Automation & CLI.
Exporting a trace
There is no single "Export" button — trace data leaves the inspector through the paths that keep the encryption boundary intact:
- From the Trace Inspector. In Raw mode, the copy button on Request body or Response body copies the complete decrypted body to the clipboard, past any on-screen truncation. The URL in the header is selectable text. This is the way to lift one exchange — a full prompt/response pair — out for a report or a bug filing.
- From the CLI. Redirect any
tracesubcommand to a file, for examplebromure-cli trace summary my-workspace > audit.txtorbromure-cli trace ls my-workspace --limit 500 > requests.txt. This is the way to capture the metadata trail for many requests at once. - From disk. The metadata JSONL under
traces/YYYY-MM-DD/is plain text (with secrets already redacted to previews) and can be read directly. The.encbody files are AES-GCM-sealed with the SecretsVault master key and are only decryptable inside the app — copy them from the inspector, not off disk.
What never leaves your Mac
For an individual, unmanaged install, tracing is entirely local:
- Traces are written to your Mac's Application Support directory and encrypted with a key held in your login Keychain.
- No trace record, body, or summary is uploaded anywhere. The proxy has no analytics endpoint wired for individual users.
- The prompt-injection classifiers that also feed the Security Log run on-device; see Prompt-Injection Detection & Guardrails. Nothing about your traffic is sent to a cloud service for scanning.
The redaction and preview rules above mean that even the data at rest never contains a usable secret. Tracing is a private audit log, not a phone-home.
Private mode and enterprise telemetry
The one case where trace-derived data leaves the machine is a Mac enrolled with a bromure.io workspace. Enrollment turns the local audit log into an organization-visible one — and gives you a switch to opt an individual workspace back out. What administrators see, and how enrollment works, is covered in Enterprise; this section describes the boundary from the tracing side.
The event stream
On an enrolled Mac, sessions stream structured cloud events to the organization's admin workspace, extracted from the same AI traffic tracing captures:
llm.request— per exchange: provider, host, path, status, latency, model, input/output token counts, and both Anthropic cache counters (cache_creation_input_tokens,cache_read_input_tokens, parsed even from SSE streams; OpenAI'scached_tokensis supported too).tool.use— every tool call, with an input summary capped at 240 characters.file.read/file.write— the extracted path and tool name.command.run— the shell command, capped at 500 characters.credential.token_swap— one per on-wire swap, previews only.prompt_injection.detection— forwarded when a detector fires, carrying the whole flagged snippet (capped at 20 KB), unlike the local Security Log's 160-character preview.egress.firewall— one per firewall verdict: host, port, protocol, and the action taken.credential.exfiltration— a fake credential was observed leaving the VM for a host outside its scope (previews and hosts only, never token bytes).- Detailed HTTP request logs — enrolled installs can additionally stream per-request HTTP metadata from the transparent interception layer, so an organization sees the workspace's outbound HTTP surface, not just its AI traffic.
Only the newest assistant turn is walked, so resent history is never double-counted, and raw prompts are never emitted — the telemetry answers "what did the AI do", not "what did the user ask".
The realtime event tap
For long-lived WebSocket sessions, waiting until the socket closes to extract events would blind an administrator for the whole session. Instead, a realtime event tap watches the server frames and emits the same llm.request / tool.use / file.read / file.write / command.run events on each response.completed, so a running Realtime session reports as it goes (the close-time extraction is then skipped to avoid double-counting). The tap only attaches when the workspace's trace level already captures bodies for that host — it rides on the same body-capture path as everything else in this chapter, and has no local UI of its own.
Private mode
Private mode is a per-workspace switch on the Tracing pane, shown only on enrolled Macs. When enabled, that workspace stops streaming session metadata and the events above to the bromure.io workspace — neither the title-bar indicator nor the admin's session list sees anything from it. Local tracing and the Trace Inspector are unaffected: you still get the full encrypted trace on your own machine.
It exists for exactly the case where local audit and organizational telemetry should diverge — for example, a workspace where you use a personal API key and do not want that activity in your organization's dashboards. On an unenrolled Mac there is nothing being streamed, so the switch is hidden entirely.
Note: Private mode suppresses
prompt_injection.detectionevents too, so on a private workspace an injection is still recorded locally in the Security Log (and enforced according to your detection action) but is not forwarded to your organization. See Tracing settings for the switch itself and Enterprise for what enrollment streams.